
User experience (UX) is the backbone of any successful website. Understanding how users interact, where they click, how far they scroll, and what grabs their attention is pivotal. To gain these critical insights, website heatmap tools have become an indispensable asset. These tools, through their color-coded visual representations, provide a window into the users’ journey on a website. They illuminate the areas that users interact with the most and the sections they overlook, offering a unique perspective on your website’s design effectiveness. With these insights, you can refine your website layout, optimize navigation, and better align your content with user interests, ultimately leading to improved engagement and conversion rates. In the list below, we’ve compiled the top website heatmap tools that excel in delivering precise and valuable UX insights.
What is heatmap software?
Website heatmap software is an analytical tool designed to illustrate where visitors interact with a webpage. These interactions are visually mapped out and color-coded. Higher interaction areas are usually depicted in warmer colors such as red or orange, hence the term ‘heatmap’. This software helps marketers gain a more profound understanding of visitor behavior. It can reveal which parts of a website are most attractive or useful to the audience, facilitating improvements in web design and user experience.
How does heatmap software help me?
Utilizing website heatmap software can offer invaluable insights into user behavior. Traditional metrics might give you an overview of page views or bounce rates, but heatmaps delve deeper. They reveal not just what users are doing, but also how they’re navigating and interacting with your webpage. By understanding which areas of your site users engage with the most, you can refine elements like content placement, link positioning, and call-to-action buttons to better cater to your audience’s needs and drive higher conversions.
What should I look for in heatmap software?
When choosing heatmap software, consider its ease of use, the types of heatmaps it offers (like click, scroll, or move heatmaps), and whether it provides real-time data. Additional features like session recordings, conversion funnels, and A/B testing can also be beneficial. Lastly, check the tool’s reputation through online reviews and ensure it fits your budget.
Top 20 website heatmap tools for user experience insights

Plerdy shines with its comprehensive suite of tools, including click and scroll heatmaps and an SEO-checker to optimize your website. Unique to Plerdy is its Sales Performance heatmap, showing which parts of your website lead to sales. User reviews applaud Plerdy’s ease of use and valuable insights. Plerdy is based in Ukraine and has 10-50 employees.
Why we ranked Plerdy as the best website heatmap tool:
- High online user reviews (4.9 stars on Capterra & Getapp; 4.5 stars on G2)
- Real-time tracking
- Ability to handle dynamic elements
- Custom user group features
- Segmentation by traffic channels & more
- Ability to filter (i.e. hide empty clicks)
- Handles website design changes well
- Easy insights (i.e. detects least effective website elements)
- Prices are cheaper than competitors
Notable clients: Subaru, Honda, Samcart
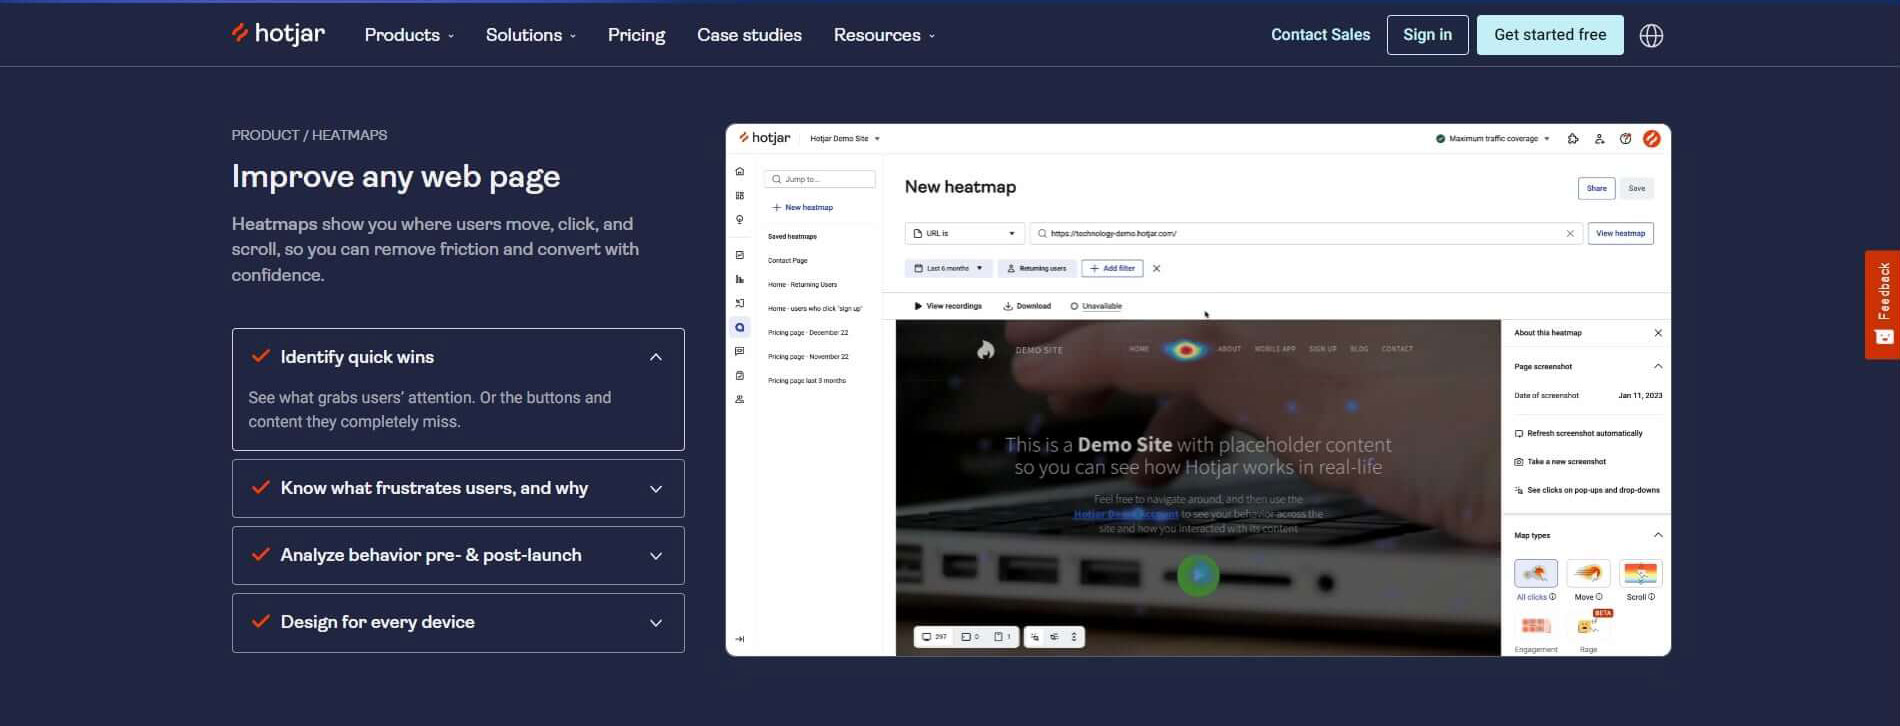
Hotjar provides a complete toolkit: heatmaps, visitor recordings, conversion funnels, and more. Notably, its heatmaps are mobile-responsive. User feedback is consistently positive, praising Hotjar’s intuitive interface and robust feature set. Hotjar is based in Malta and has 100-250 employees. It has a rating of 4.6 out of 5 stars on G2.
Hotjar’s Heatmaps stand out with their compelling visual display of user interaction data. From identifying frequently clicked elements to illuminating less-engaged sections, these heatmaps offer a detailed overview of user behavior on a website. Hotjar presents this data in an intuitive, color-coded format, with varying shades representing different degrees of user engagement.
Hotjar’s Heatmaps can serve as a powerful tool for website optimization. They provide valuable insights for marketers seeking to enhance site design or improve user experience. By revealing trends in visitor behavior and potential obstacles in the user journey, these heatmaps can help guide data-driven decisions and strategies. However, the effectiveness of Hotjar’s Heatmaps hinges on the user’s ability to accurately interpret and apply the presented data.
Pros:
- Popular and well-respected tool
- Wide range of features
- Good customer support
- Many integrations
Cons:
- Can be expensive
- Not as easy to use as some other heatmap tools
Notable clients: Hubspot, Adobe, Hellofresh
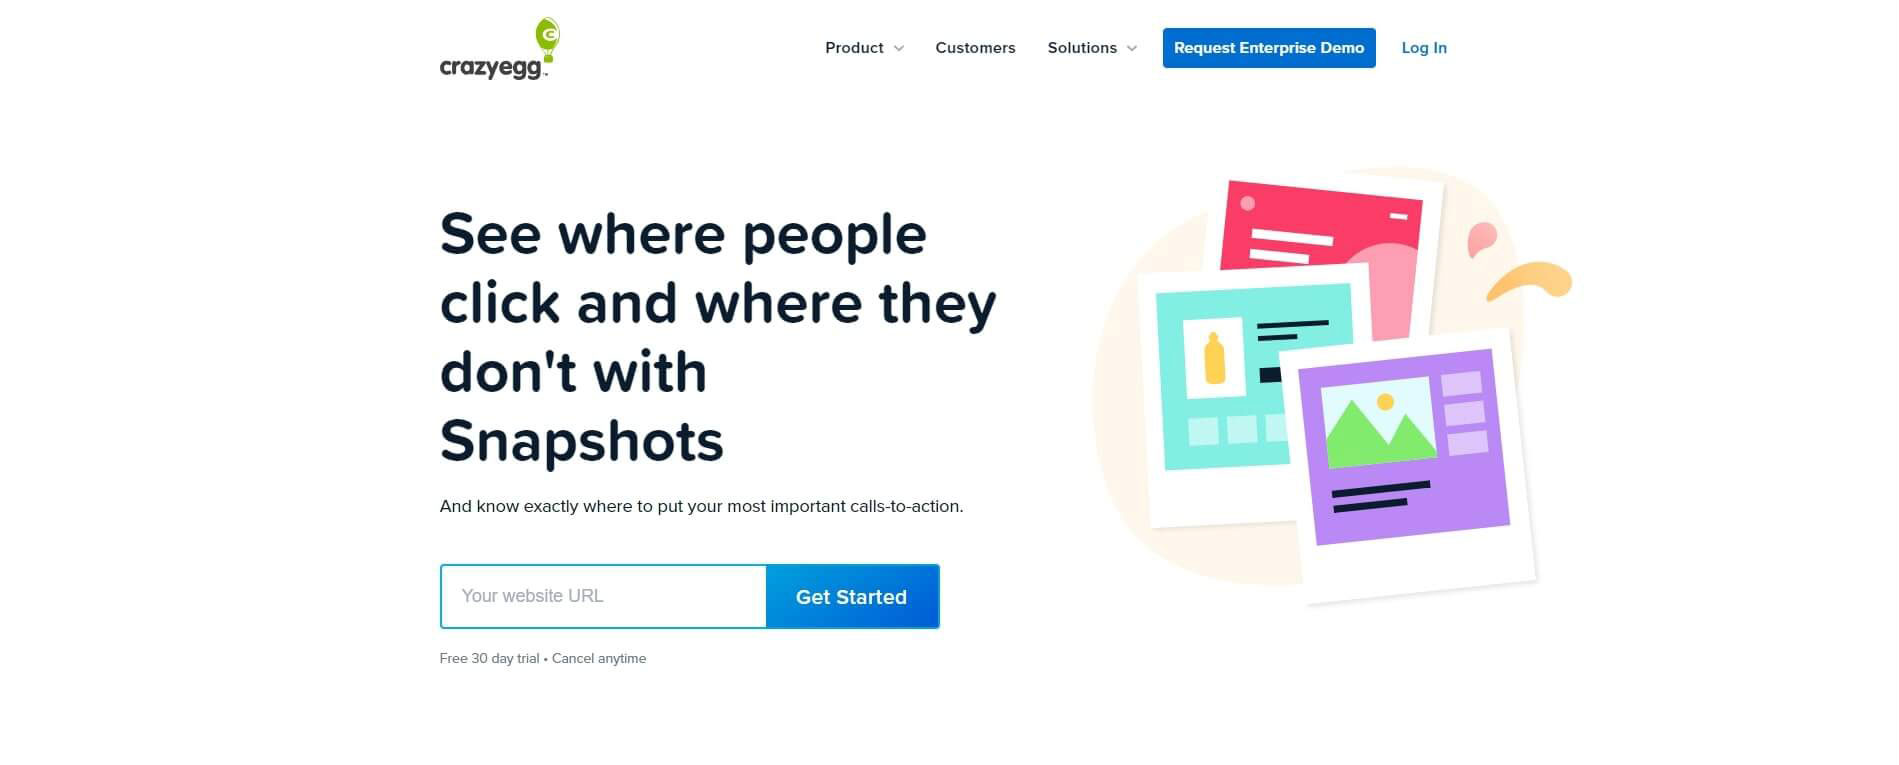
Crazy Egg goes beyond traditional heatmaps, providing scroll and confetti heatmaps for a deeper understanding of visitor behavior. Users also value its A/B testing feature. Reviews commonly praise its robust data and ease of use. Crazy Egg is based in the United States and has 50-200 employees. It has a rating of 4.4 out of 5 stars on G2.
Crazy Egg’s Snapshots offer an in-depth look at your website’s performance by collecting and visualizing user interaction data. It uses advanced technology to generate heatmaps that show exactly where users are clicking and how far they’re scrolling. With features such as scroll maps and overlay reports, Crazy Egg’s Snapshots provide granular insight into how different elements on your website perform over time.
Crazy Egg Snapshots can provide key insights to improve website functionality and user experience. They reveal potential friction points that may impede the user journey, and highlight areas of high engagement, assisting marketers in making evidence-based decisions. However, the potential of these snapshots is best realized when the collected data is accurately interpreted and effectively integrated into a website’s improvement strategy.
Pros:
- Easy to use
- Clear and concise insights
- Affordable pricing
Cons:
- Not as many features as some other heatmap tools
- Some features are only available on the paid plans
Notable clients: Dell, Etsy, Intuit, CNet
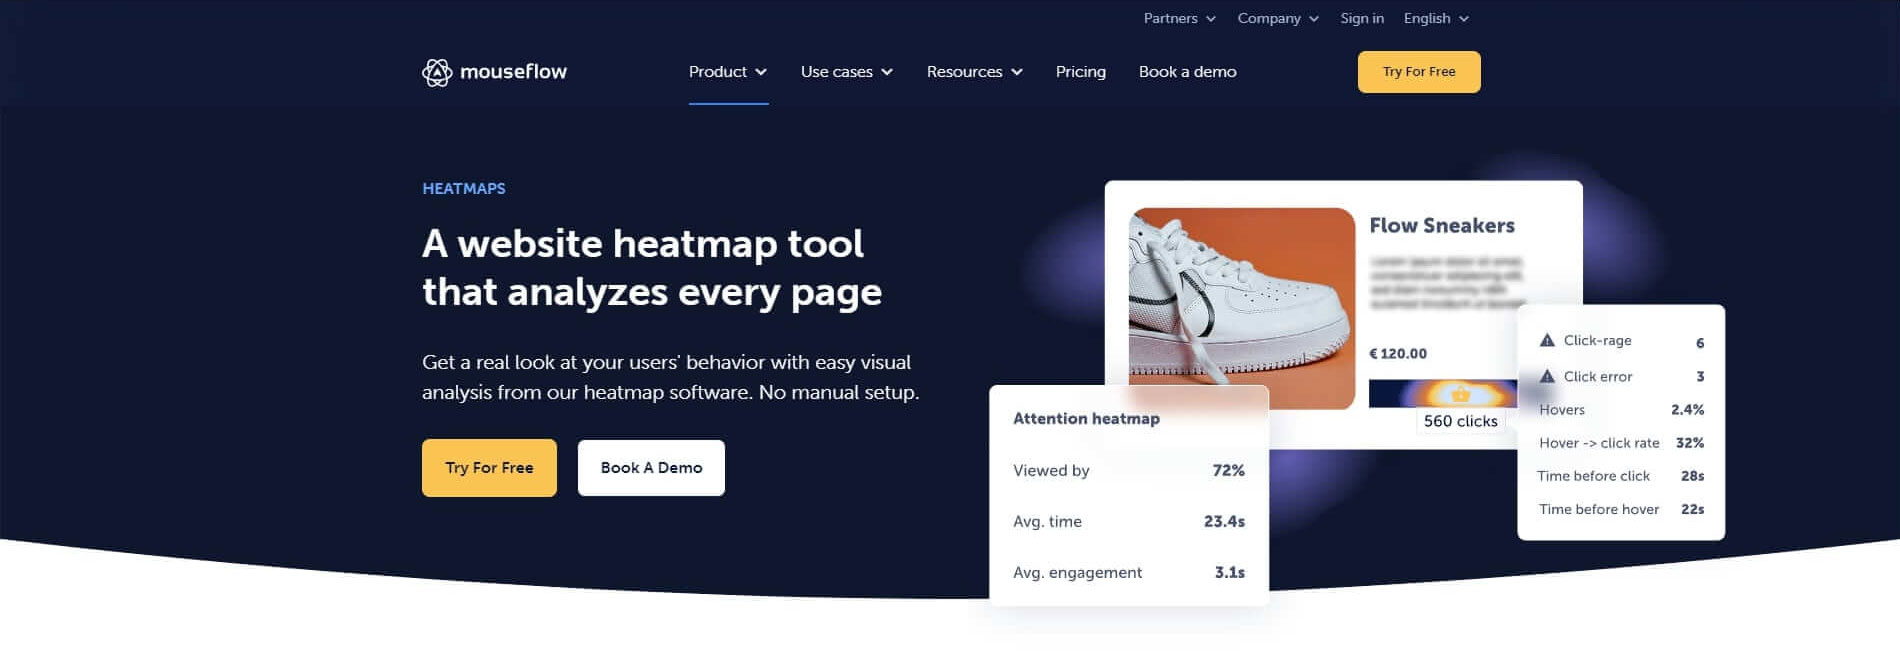
With click, movement, scroll, attention, and geographical heatmaps, Mouseflow is a comprehensive suite. It’s also popular for session replay and form analytics. User reviews commend its extensive features and data accuracy. Mouseflow is based in Denmark and has 50-200 employees. It has a rating of 4.5 out of 5 stars on G2.
Mouseflow’s Heatmaps provide a powerful analysis tool for understanding how visitors interact with your website. With its dynamic visualization of clicks, mouse movements, and scrolls, Mouseflow captures the detailed nuances of user behavior. It also stands out with its ability to generate attention and geo heatmaps, offering a holistic view of user engagement and geographical user patterns.
Mouseflow Heatmaps serve as a critical resource for enhancing website design and usability. They help identify the elements that draw attention and those that are overlooked, enabling marketers to adjust their strategies accordingly. As with other heatmap tools, the success of Mouseflow Heatmaps lies in the proper interpretation and strategic application of the data it provides.
Pros:
- Detailed insights into user behavior
- Wide range of features
- Good customer support
Cons:
- Can be expensive
- Not as easy to use as some other heatmap tools
Notable Clients: Philips, Verizon, Scotts, Vodafone
#5 Glassbox |
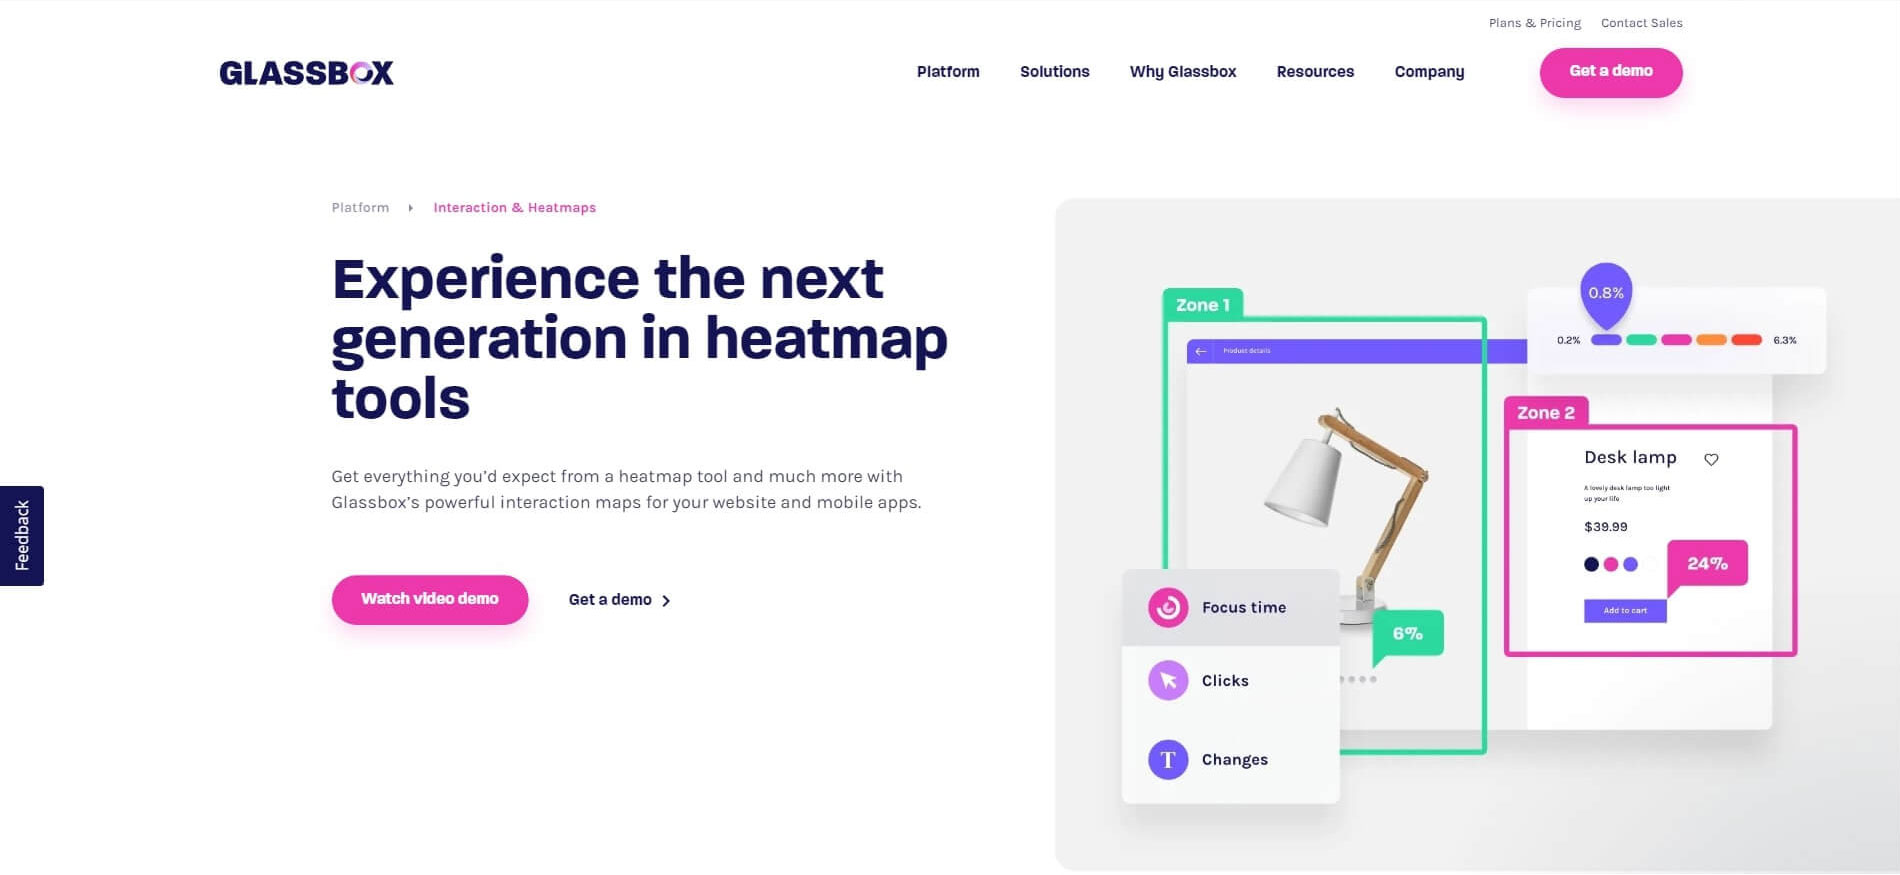
Glassbox offers a variety of heatmap types and integrates with other analytics tools. Compared to most competitors, Glassbox is more affordable and easier to use. We recommend Glassbox if it has your required integration and you are a non-technical user. Glassbox is based in the United States and has 10-50 employees. It has a rating of 4.4 out of 5 stars on G2.
Glassbox’s heatmap tool captures the essence of user interaction on your website with a unique blend of features. It tracks and visualizes not only clicks and scrolls but also pinch, zoom, and swipe actions on mobile devices, giving a comprehensive view of user engagement across platforms. Its distinctive feature is the ability to provide real-time heatmap analytics, providing up-to-the-minute insights into website performance.
The utility of Glassbox’s heatmaps lies in the depth of insights they provide for website optimization. From helping pinpoint areas of high engagement to identifying user pain points, these heatmaps guide marketers and web designers in their decision-making process. The real-time component further enhances their ability to react quickly to emerging patterns. Nevertheless, the effectiveness of Glassbox’s heatmap tool depends on the user’s proficiency in interpreting and applying the insights derived from the data.
Pros:
- Detailed insights into user engagement with content
- Wide range of features
- Good customer support
Cons:
- Can be expensive
- Not as easy to use as some other heatmap tools
Notable Clients: Spotify, Booking.com, eBay

Ptengine excels in providing real-time data and heatmaps. It’s also great for event tracking. Users love its user-friendly interface and detailed analytics. Ptengine is based in Japan and has 10-50 employees. It has a rating of 4.5 out of 5 stars on G2.
Ptengine Insight’s heatmap tool offers a user-friendly interface for visualizing visitor engagement on your website. It effectively tracks and showcases clicks, mouse movements, and scroll behavior, and has a unique strength in segmenting data. This tool lets you filter results based on device type, traffic source, and even user demographics, providing tailored insights into specific user groups. The segmentation feature allows for a more focused analysis of different user groups.
Pros:
- Affordable pricing
- Easy to use
- Good customer support
- Good for businesses in Japan
Cons:
- Not as many features as some other heatmap tools
- Some features are only available on the paid plans
Notable Clients: Casio, Lifull, Oisix, DMM.com
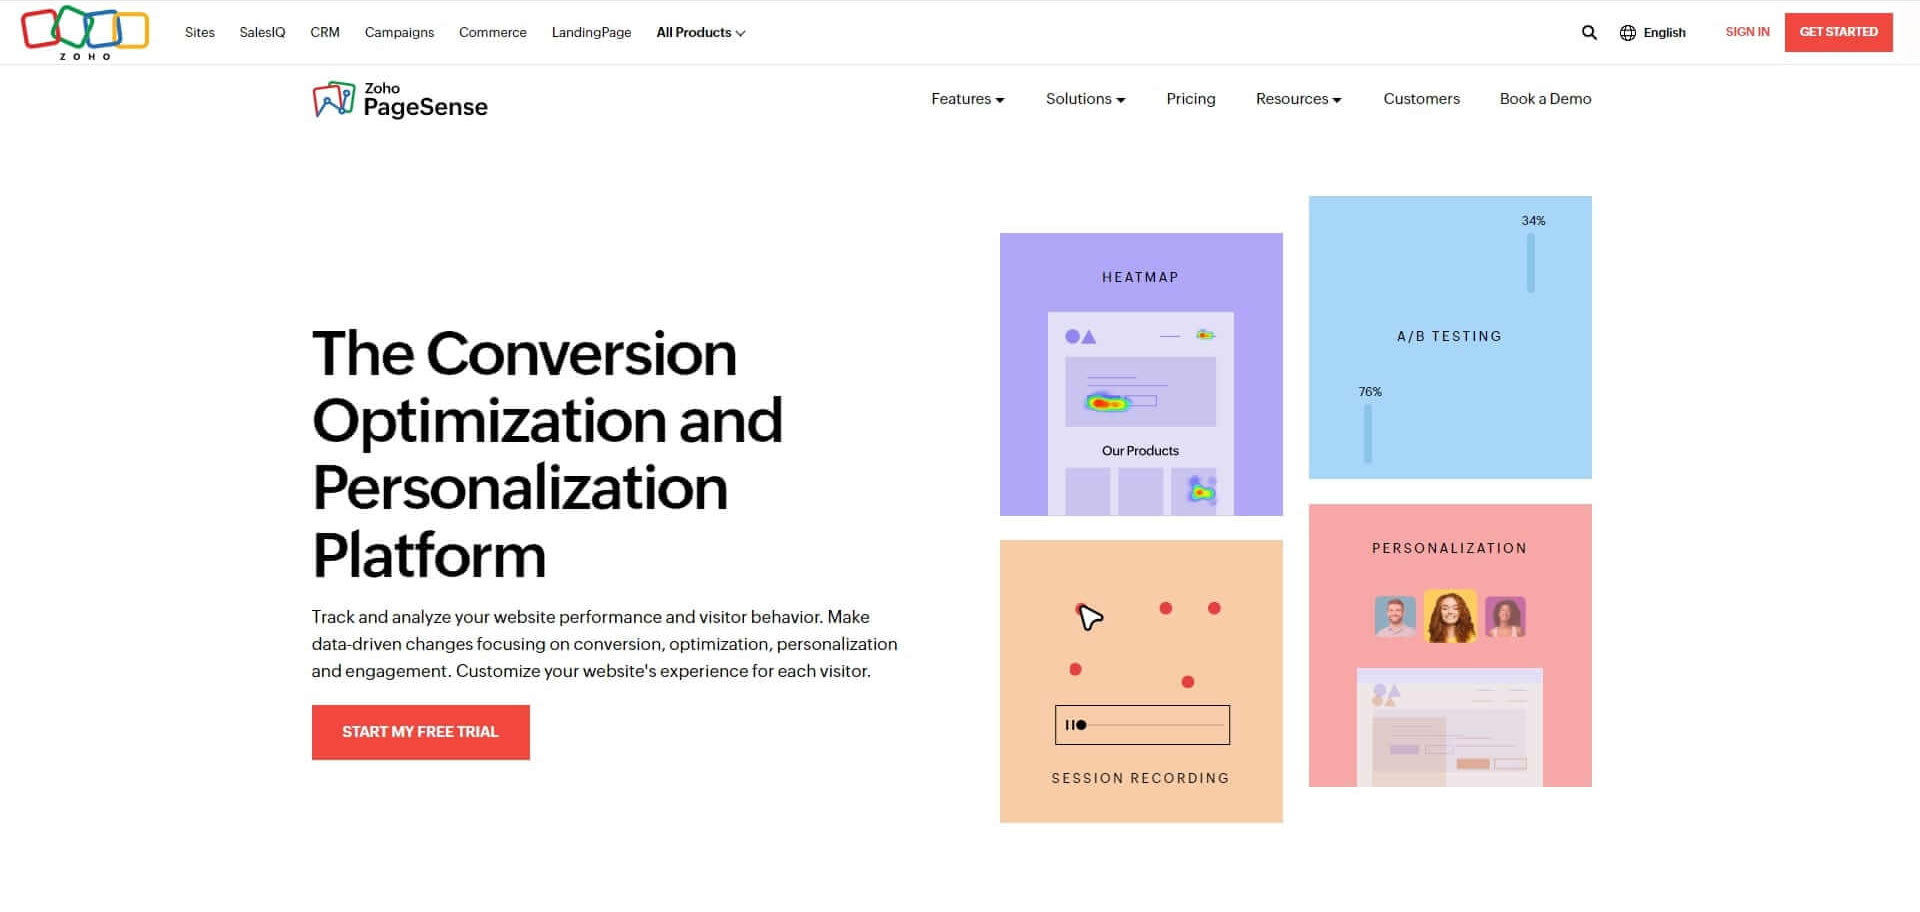
As part of the Zoho suite, PageSense impresses with its intuitive dashboard and detailed heatmaps. Users highlight its seamless integration with other Zoho products and its value for money. Zoho is based in India & Austin and has 1,000-5,000 employees. It has a rating of 4.4 out of 5 stars on G2.
Zoho PageSense’s heatmap tool is a reliable solution for visually representing user interactions on your website. It meticulously tracks clicks, scrolls, and mouse movements, delivering detailed and color-coded heatmaps. It’s noted for its ease of use and seamless integration with other Zoho products, making it a particularly compelling choice for businesses already leveraging the Zoho ecosystem.
Pros:
- Affordable pricing
- Easy to use
- Wide range of features
- Good customer support
- Part of Zoho’s suite of website analytics tools
Cons:
- Not as many integrations as some other heatmap tools
- Some features are only available on the paid plans
Notable Clients: L’Oreal, Spicejet, Daimler, Zomato
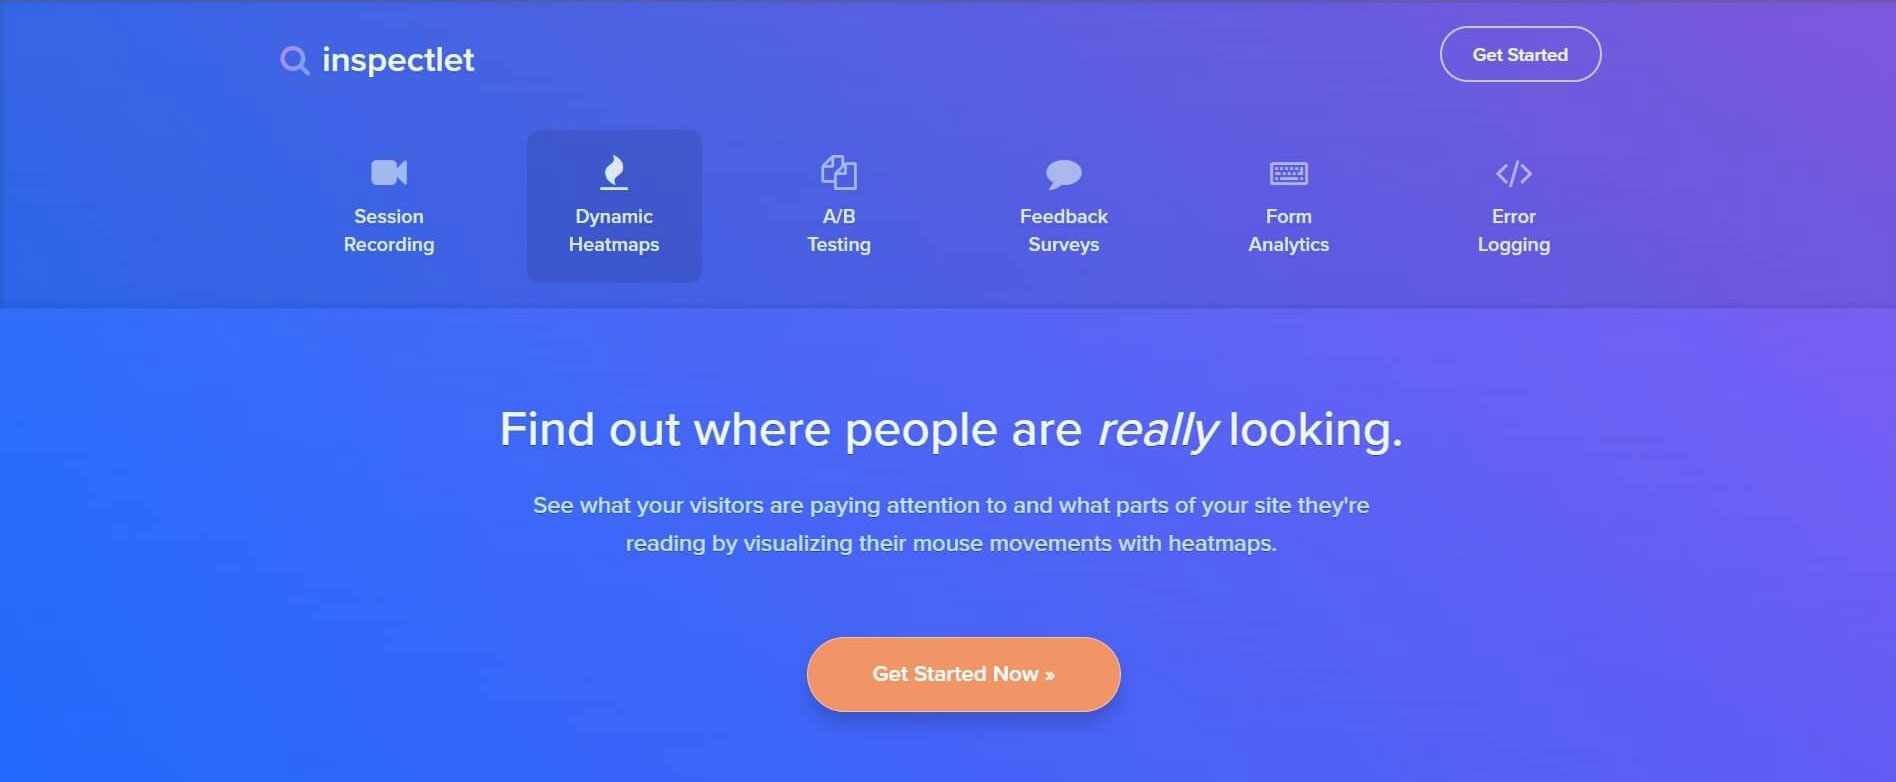
Known for eye-tracking heatmaps, Inspectlet also offers session recordings and A/B testing. User reviews frequently mention its robust analytics and easy setup. Inspectlet is based in the United States and has 10-50 employees. It has a rating of 4.5 out of 5 stars on G2.
Inspectlet Dynamic Heatmaps provide a detailed visual analysis of how users interact with your website. Noteworthy for capturing even the complex interactions, Inspectlet tracks and illustrates clicks, mouse movements, scrolls, keypresses, and window resizing. This comprehensive tracking makes it an excellent tool for understanding the totality of user behavior on your site.
Pros:
- Dynamic heatmaps allow you to see how user behavior changes over time
- Wide range of features
- Good customer support
Cons:
- Can be expensive
- Not as easy to use as some other heatmap tools
Notable Clients: Shopify, ebay, MediaFire, heroku
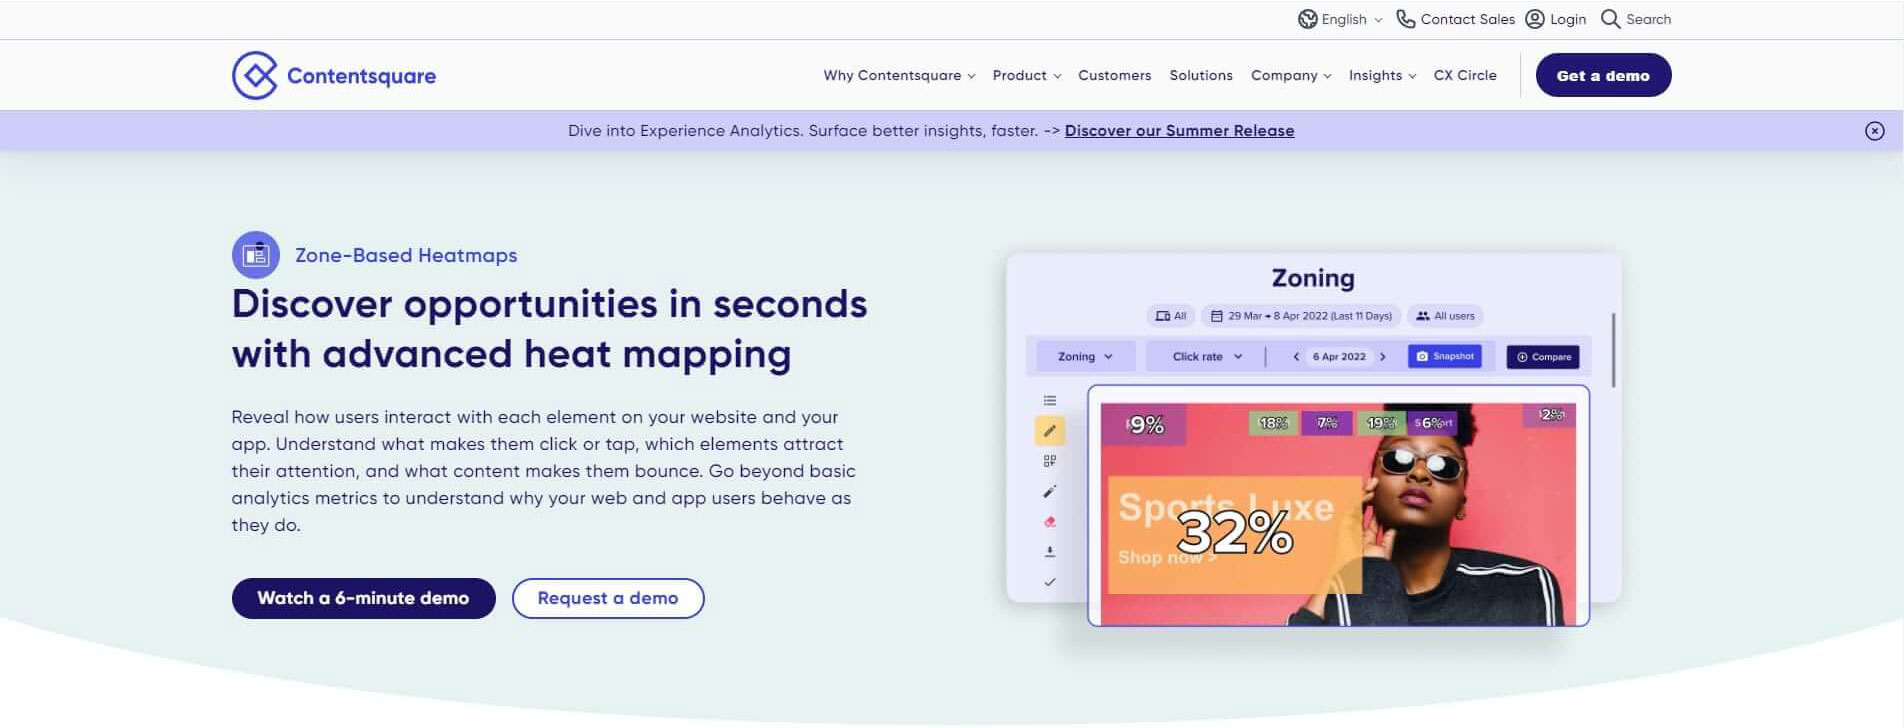
Part of Contentsquare, Clicktale specializes in advanced heatmap analytics, like rage clicks and anomaly detection. Users appreciate its in-depth user behavior insights. Contentsquare is based in France and has 500-1,000 employees. It has a rating of 4.5 out of 5 stars on G2.
Contentsquare’s Zone-Based Heatmaps offer a unique approach to tracking and visualizing user behavior on your website. Unlike traditional heatmaps, they segment the website into distinct zones, allowing for a more detailed analysis of user interaction within each specific area. This zone-based segmentation gives a nuanced perspective on how different components of your site perform.
When used effectively, Contentsquare’s Zone-Based Heatmaps can provide invaluable insights for optimizing the user experience. They help identify the most engaging zones on your site, as well as areas that may be causing friction for users. These insights can guide strategists, marketers, and web designers in making informed improvements. However, the successful utilization of Contentsquare’s heatmaps depends heavily on the user’s ability to interpret the zone-based data and translate these insights into actionable changes.
Pros:
- Zone-based heatmaps allow you to see how user behavior changes across different areas of your website
- Wide range of features
- Good customer support
Cons:
- Can be expensive
- Not as easy to use as some other heatmap tools
Notable Clients: Sephora, Zoom, Samsung, NatWest
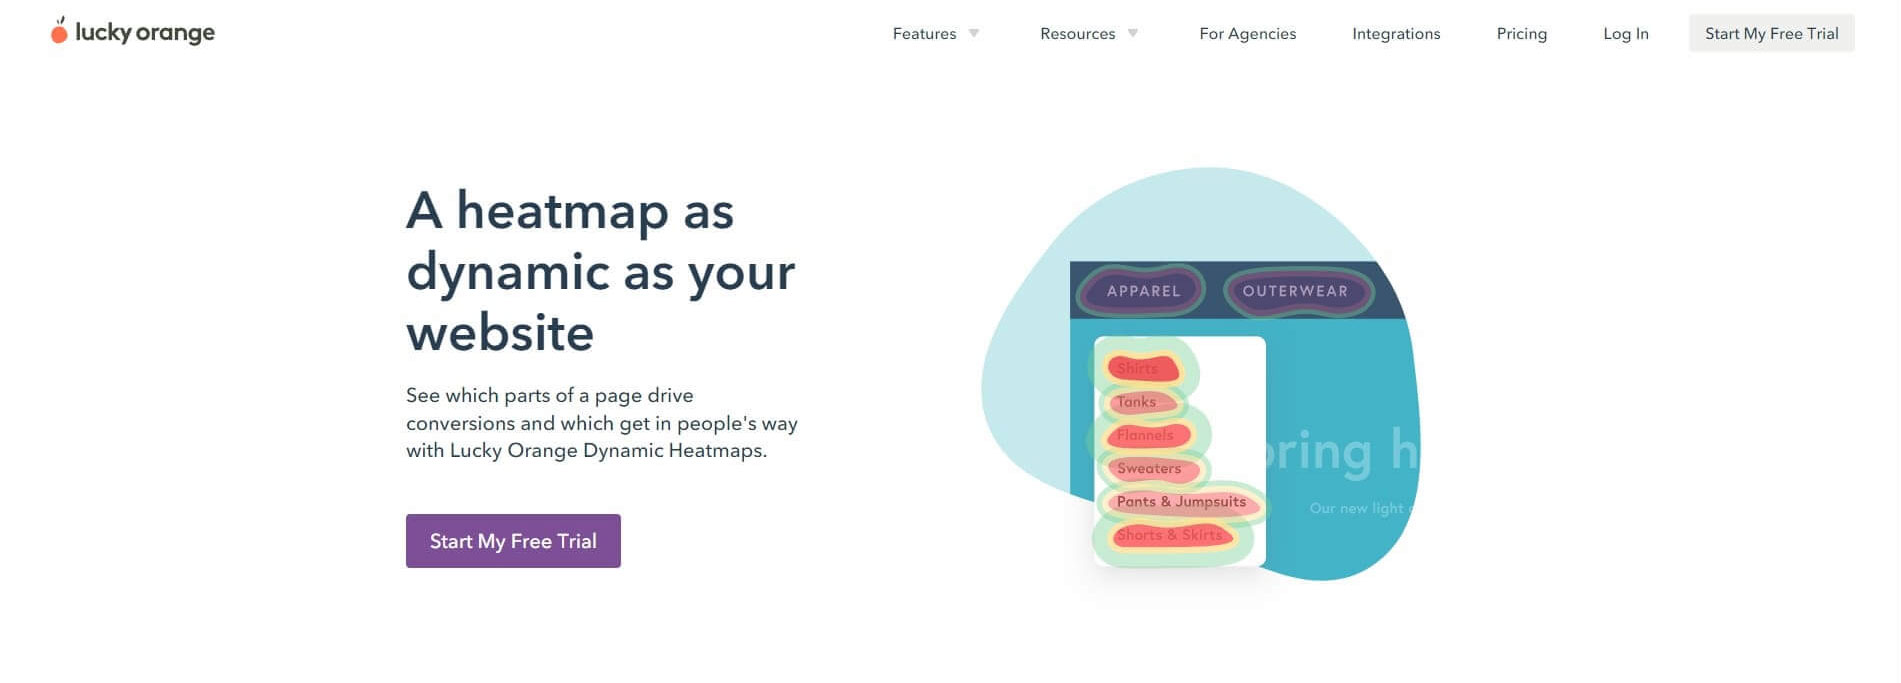
It’s a standout for real-time heatmap data and dynamic heatmaps for interactive content. It also shines with visitor recordings and form analytics. Users appreciate its in-depth insights and easy navigation. Lucky Orange is based in the United States and has 10-50 employees. It has a rating of 4.5 out of 5 stars on G2.
Lucky Orange’s Dynamic Heatmaps present a comprehensive view of user interactions on your website. Recognized for their real-time tracking capability, they visualize clicks, mouse movements, and scrolls as they occur. The inclusion of dynamic elements, like drop-down menus and pop-ups, offers a more holistic perspective on visitor interactions with your site.
Pros:
- Dynamic heatmaps allow you to see how user behavior changes over time
- Wide range of features
- Good customer support
Cons:
- Can be expensive
- Not as easy to use as some other heatmap tools
Notable clients: Salesforce, Adobe, IBM
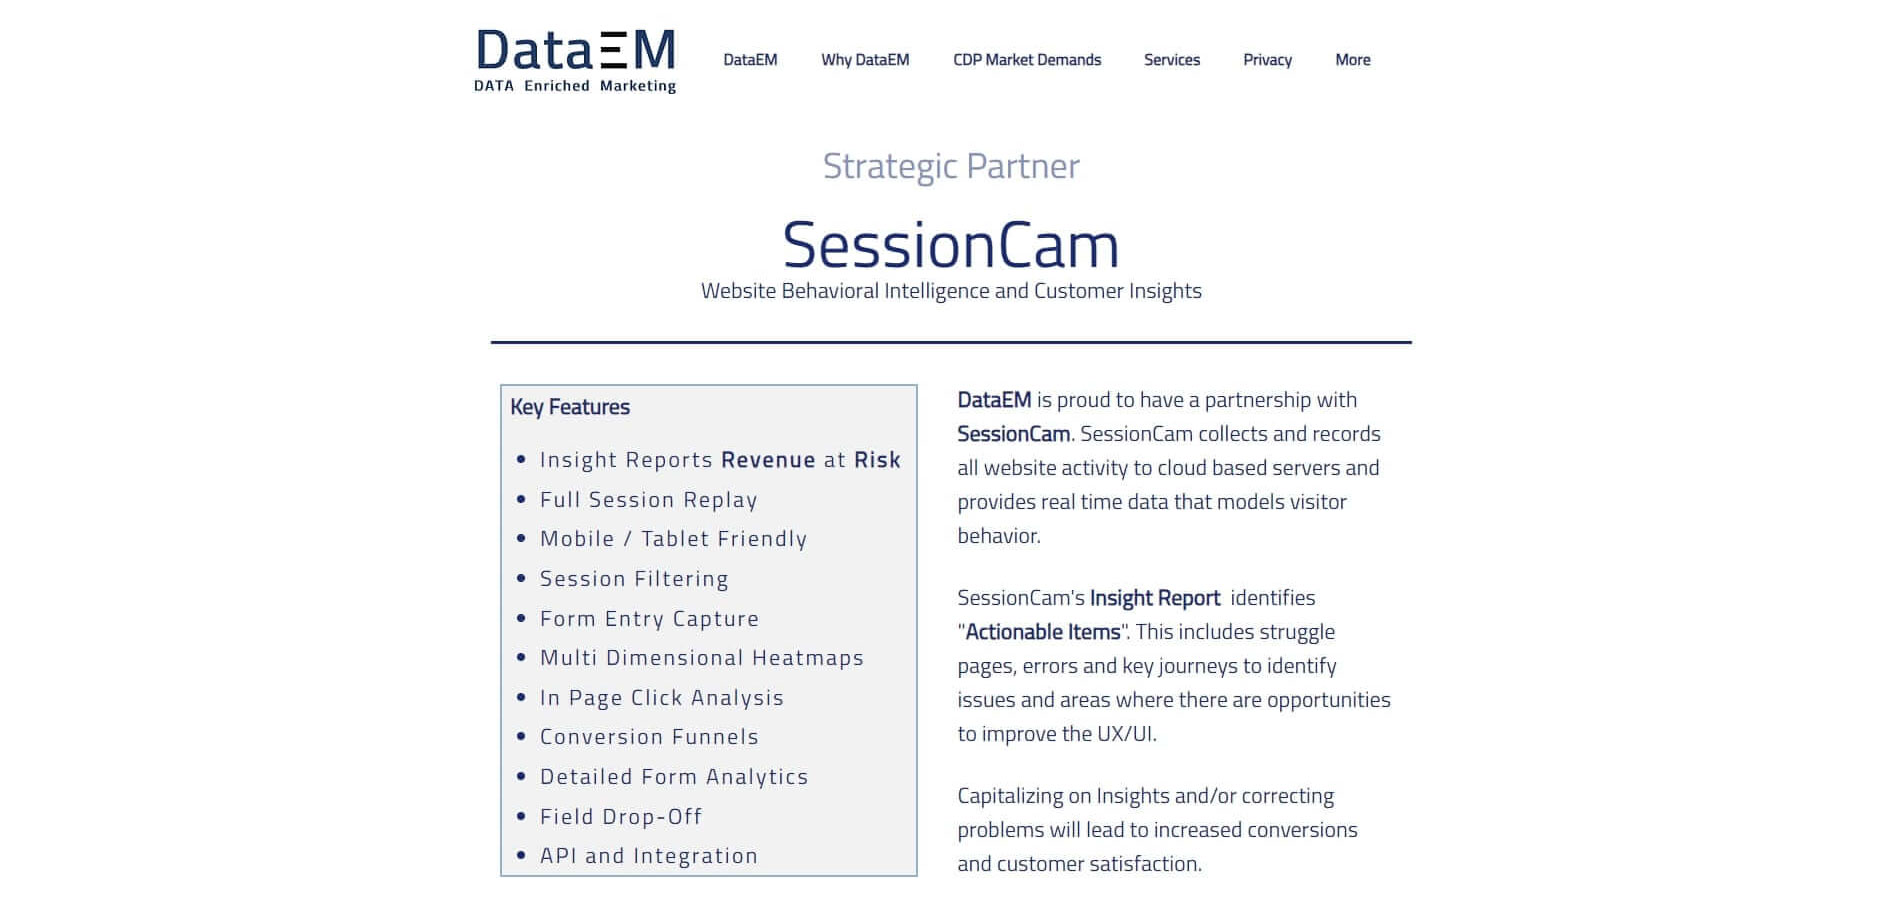
This tool offers heatmaps, session replays, and form analytics. Its standout feature is the Customer Struggle Score, which identifies problem areas. Users love its rich functionality and excellent customer service. DataEM is based in the United States and has 10-50 employees. It has a rating of 4.3 out of 5 stars on G2.
DataEM’s SessionCam offers a powerful heatmap tool that visualizes complex user interactions on your website. It tracks and represents clicks, mouse movements, and scrolls, but stands apart with its unique focus on customer struggle. By identifying patterns that indicate user frustration, SessionCam delivers insights not only on where users interact but also where they encounter difficulties.
Pros:
- Session recordings allow you to watch how users interact with your website in real time
- Wide range of features
- Good customer support
Cons:
- Can be expensive
- Not as easy to use as some other heatmap tools

Visual Website Optimizer offers heatmaps alongside its suite of A/B testing tools. Users appreciate its multiple heatmap types and easy-to-use platform. VWO is based in the Netherlands and has 100-250 employees. It has a rating of 4.5 out of 5 stars on G2.
VWO’s Website Heatmap is an effective tool for visually analyzing user interactions on your website. Known for its user-friendly interface, it tracks and displays clicks, mouse movements, and scrolls, delivering data in a vivid, color-coded format. Its standout feature is its segmentation capability, allowing for targeted analysis based on specific user categories.
Pros:
- Wide range of features, including heatmaps, session recordings, and A/B testing
- Good customer support
- Many integrations
Cons:
- Can be expensive
- Not as easy to use as some other heatmap tools
Notable Clients: Suzuki, British Red Cross, Emerson, Equinox
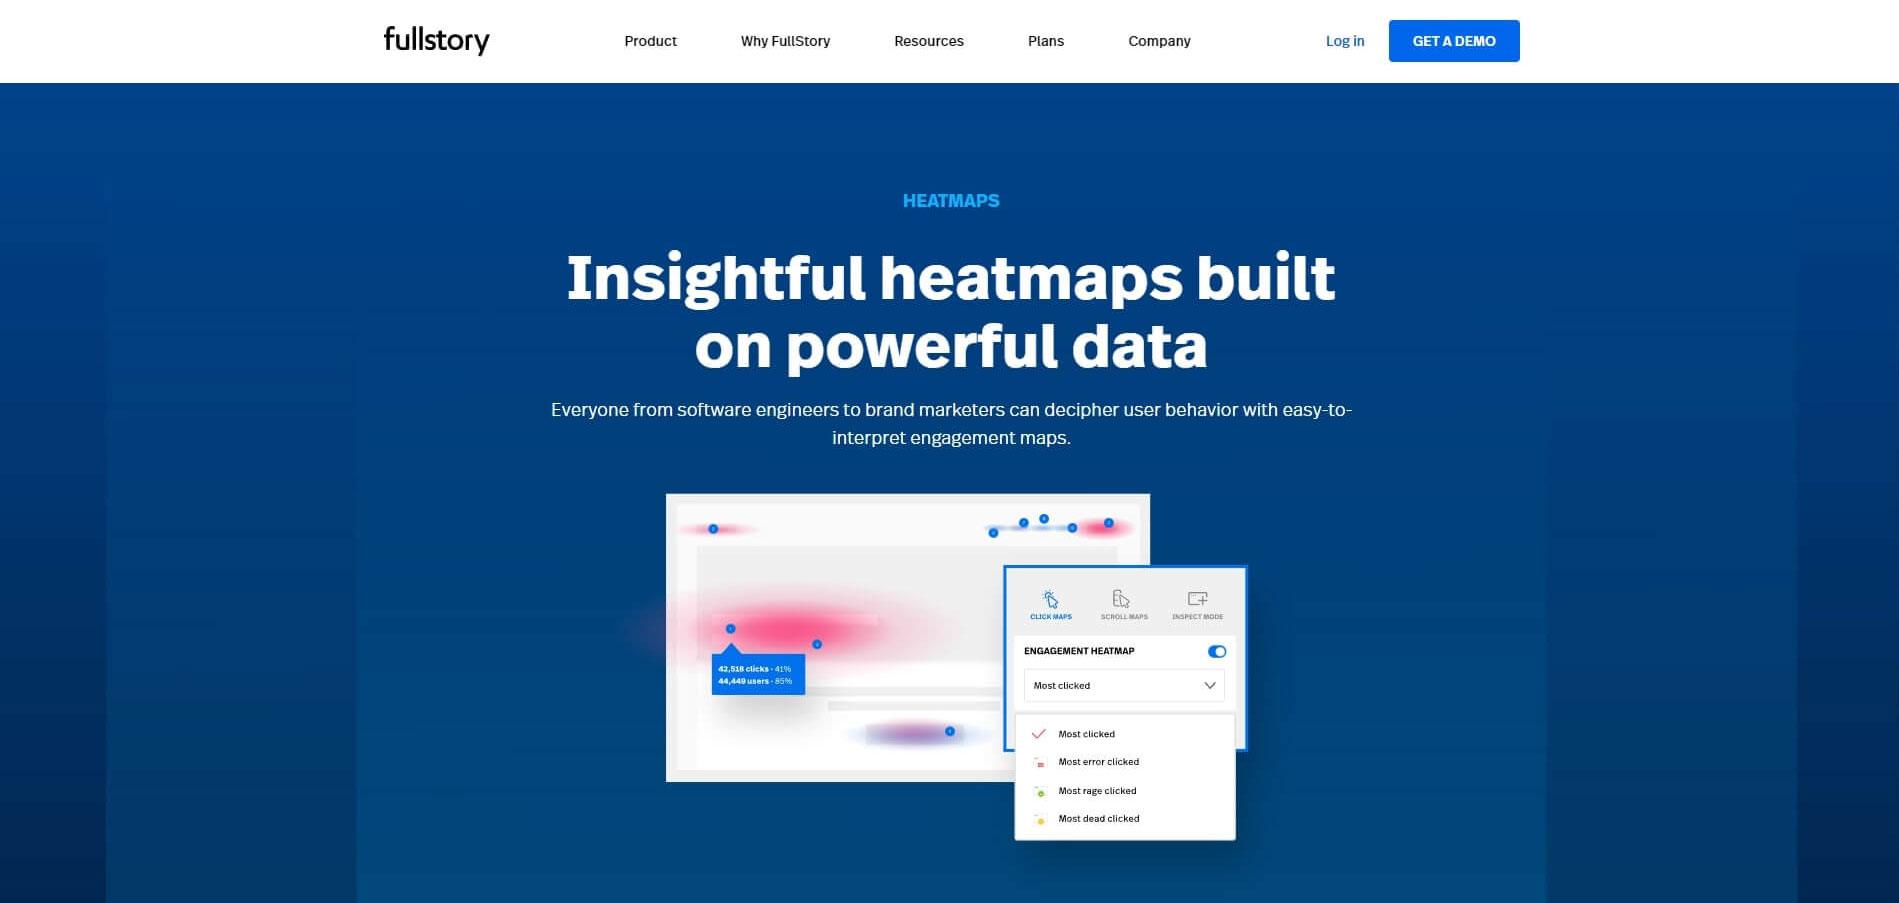
Known for its robust platform, FullStory offers heatmaps, session replay, and funnels. Its unique Click Maps feature is also popular. Reviews praise its comprehensive features and data accuracy. FullStory Heatmaps is based in the United States and has 500-1,000 employees. It has a rating of 4.5 out of 5 stars on G2.
Pros:
- Detailed insights into user behavior, including heatmaps, session recordings, and user feedback
- Good customer support
- Many integrations
Cons:
- Can be expensive
- Not as easy to use as some other heatmap tools
Notable Clients: KeyBank, Lowe’s, Groupon, Sendoso, jetBlue
#14 LiveSession |
LiveSession pitches itself as a full-service solution for digital experience analytics. While most of their analytics overlaps with that of Google Analytics, LiveSession does provide some extra features such as screen replays. They offer a free version that includes clickmaps & heatmaps for 1,000 sessions. LiveSession is based in the United States and has 10-50 employees. It has a rating of 4.4 out of 5 stars on G2.
Pros:
- Session recordings allow you to watch how users interact with your website in real time
- Wide range of features
- Good customer support
Cons:
- Can be expensive
- Not as easy to use as some other heatmap tools
Notable Clients: ING, databox, kissflow, FundraiseUp

A comprehensive solution, Yandex Metrica offers heatmaps, session replay, and behavior tracking. It’s well-reviewed for its wealth of features and price point – free! Yandex is based in Russia and has 1,000-5,000 employees. It has a rating of 4.4 out of 5 stars on G2.
Pros:
- Affordable pricing
- Easy to use
- Good customer support
- Good for businesses in Russia
Cons:
- Not as many features as some other heatmap tools
- Not as many integrations as some other heatmap tools
#16 Heatmap.me |

Known for real-time analytics and simplicity, Heatmap.me provides click and scroll heatmaps. Its minimalist design and user-friendliness often attract positive reviews. Heatmap.me is based in the United States and has 1-10 employees. It has a rating of 4.5 out of 5 stars on G2.
Pros:
- Affordable pricing
- Easy to use
- Good customer support
- Open source
Cons:
- Not as many features as some other heatmap tools
- Not as many integrations as some other heatmap tools
#17 LogRocket |
LogRocket is a solution that is primaril;y focused on finding website problems. As part of their suite of solutions, they have UX Analytics which includes heat and click maps. We recommend LogRocket if your main purpose is to find & solve site issues, and not A/B optimization. LogRocket is based in the United States and has 50-200 employees. It has a rating of 4.5 out of 5 stars on G2.
Pros:
- Detailed insights into user behavior, including heatmaps, session recordings, and error tracking
- Good customer support
- Many integrations
Cons:
- Can be expensive
- Not as easy to use as some other heatmap tools
Notable Clients: Pinterest, MGM Resorts, Ikea, Blizzard
#18 SmartLook |
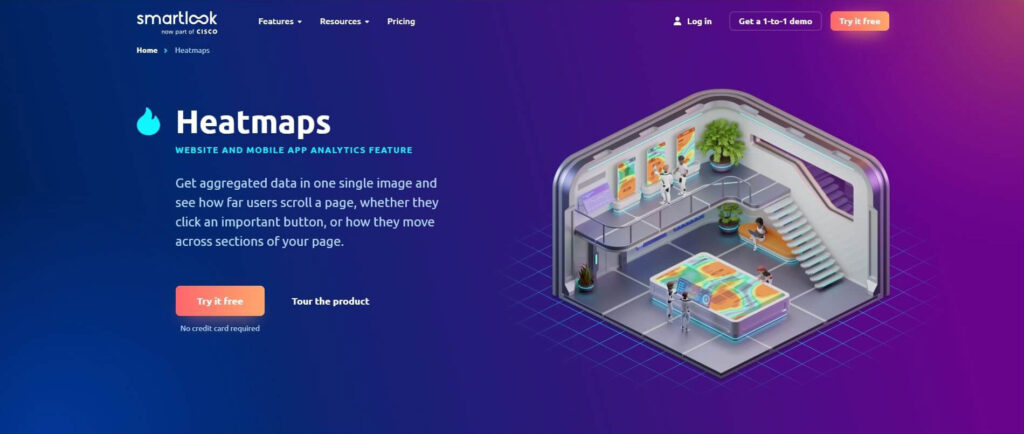
SmartLook is a SAAS solution that was purchased by Cisco in 2023. Smartlook provides website heatmap tools and other analytics for mobile apps. Smartlook has over 50 integrations, including Zapier which enables you to connect 1000’s of other apps. SmartLook is based in the Czech Republic and has 10-50 employees. It has a rating of 4.5 out of 5 stars on G2.
Pros:
- Detailed insights into user behavior, including heatmaps, session recordings, and user feedback
- Good customer support
- Many integrations
Cons:
- Can be expensive
- Not as easy to use as some other heatmap tools
Notable Clients: Papa John’s Pizza, livestorm, Tersco, Kiwi.com
#19 UXWizz |
A self-hosted solution, UserTrack offers heatmaps and user session replays. It’s particularly appreciated for its data privacy features. UXWizz is based in the United States and has 1-10 employees. It has a rating of 4.5 out of 5 stars on G2. Microsoft Clarity Heatmaps is based in the United States and has 10,000+ employees. It has a rating of 4.4 out of 5 stars on G2.
Pros:
- Affordable pricing
- Easy to use
- Good customer support
- Open source
Cons:
- Not as many features as some other heatmap tools
- Not as many integrations as some other heatmap tools

This free tool from Microsoft offers heatmaps and session replays. Clarity’s “Rage Clicks” detection is a unique and loved feature.
Each of these tools brings unique offerings to the table. By assessing your specific needs, online reviews, and budget, you can choose a heatmap tool that best fits your website optimization goals.
Pros:
- Affordable pricing
- Easy to use
- Good customer support
- Part of Microsoft’s suite of website analytics tools
Cons:
- Not as many features as some other heatmap tools
- Not as many integrations as some other heatmap tools
FAQs
What features should I consider when choosing a website heatmap software?
Key features of an effective website heatmap software include an intuitive interface that makes the tool easy to navigate, real-time data functionality for instant insights, and various heatmap types (click, move, and scroll) for comprehensive analysis. Segmentation capabilities that allow data filtering by different variables (such as device type or traffic source) are also important. Integration with other analytics tools can create a more holistic view of your site’s performance. It’s essential the tool is scalable, able to handle your website’s traffic and data load without performance issues. Lastly, consider if the software supports responsive design, as many users now access websites from various devices.
How can I determine the usability of a heatmap tool?
The most direct way to gauge the usability of a heatmap tool is to take advantage of a free trial, if available. During the trial period, assess how user-friendly the tool is, the ease of installation, the clarity of the data reports, and the overall fit for your specific needs. Also, read reviews and testimonials from other marketers and users. Their experiences can provide valuable insights into the tool’s practical usability and effectiveness.
Why should the website heatmap software support mobile heatmaps?
With the continued surge in mobile internet usage, having a website heatmap software that supports mobile heatmaps is critical. Mobile heatmaps allow you to visualize how users interact with your website on smaller screens, different operating systems, and in the context of mobile-specific features. With these insights, you can optimize your site’s mobile version for better user experience and performance.
What’s the role of real-time data in heatmap software?
Real-time data provides immediate insights into the effects of any changes you make to your website, capturing user interaction as it happens. This is especially valuable if you’re running A/B tests or have recently launched new site features or products. Real-time heatmaps can help you quickly identify and rectify issues, or capitalize on successful modifications, keeping your site’s performance at its peak.
How important are integrations with other tools?
Integrations can significantly enhance the utility of your heatmap software. By correlating heatmap data with other user metrics from tools like Google Analytics or your CRM, you get a more comprehensive picture of user behavior. This deeper understanding allows you to make more informed decisions regarding your site’s design, layout, and content strategy.
How does the price of website heatmap software impact my selection?
While cost is certainly a significant factor, it’s essential to consider the value that the software provides. Free tools may be a good starting point, but they often lack advanced features that paid tools provide. Paid tools come at varying price points, each offering different features and levels of customer support. It’s crucial to strike a balance between your budget and the features that will deliver the most value to your business.
How can I ensure the website heatmap tool is privacy compliant?
When selecting a website heatmap tool, confirm that it’s compliant with privacy regulations like the General Data Protection Regulation (GDPR) and the California Consumer Privacy Act (CCPA). The software should anonymize collected data, refrain from gathering personally identifiable information (PII), and allow users the option to opt-out of data collection. Respecting user privacy is not only legally necessary but also fosters trust with your audience.
Can the website heatmap tool support A/B testing?
Yes, if possible, choose a website heatmap tool that either offers A/B testing functionality or integrates seamlessly with other A/B testing tools. A/B testing allows you to compare different versions of your website to see which performs better with your audience. When paired with heatmap data, you can gain rich, visual insights into how different design or content variations affect user interaction and engagement.
 Free
Consultation
 Free
Google Ads Audit


